Increasing Situational Awareness and Operational Safety Through C2 Proxy Log Analysis
Note: If anyone knows of a better / simpler / suited to automation / more lightweight solution to this problem please let me know @BaffledJimmy!
Why
Modern enterprises are complex beasts, with shadow IT, unruly configuration management and hybrid cloud deployments being business as usual. Throughout a red team engagement, it is difficult to maintain operational safety and security, whilst also maximising your visibility of the target environment and ensuring that your phishes, weaponised artifacts and communications channels are appropriately secured and whitelisted.
Operational Security – at a high level, ensuring that the integrity of the testing window is maintained and that the blue team is not able to tie your activity to your red team consultancy through comedy failures such as reverse WHOIS lookups for your consultancy name containing all your phishing and C2 infrastructure.
Operational Safety – ensuring that all red team activities are conducted in a safe manner. For example, weaponised payloads are only served to whitelisted IP addresses, second stage implants are only available to domain-joined machines and whitelisted at the C2 proxy level. This can be summarised as ensuring that you take all reasonable steps to minimise risk to the target organisation, as well as ensuring that you don’t fall foul of legislation such as the Computer Misuse Act by gaining shells on out of scope infrastructure.
Having data available to back up your assertions in red team reporting is critical. Whilst thematic points have their place in reporting, executives or regulators may ask questions such as ‘How many workstations were compromised?’, ‘How many passwords did you crack?’ and ‘How many successful user interactions and phishes did you achieve?’. Whilst the above examples are fairly simple to search hashcat, C2 logs and Apache logs on a short engagement, the premise remains the same regardless of scenario.
Without accurate data collection from the very start of the engagement, providing these metrics later in the process can be especially difficult. It can also undermine the key messaging and credibility of your reporting, as evidence based observations are the foundation of solid reporting.
As part of improving operational safety, both malicious link serving and weaponised payloads are whitelisted to the target’s IP WAN addresses on the C2 proxy via Apache (see here and here). PoshC2 will generate you appropriate Apache whitelist rules for implant comms, with ThreatExpress (great Cobalt Strike resource!) doing similar for Cobalt Strike. Any other questions on whitelisting can probably be answered at the BlueScreenofJeff GitHub.
Note that only weaponisation, delivery and staging / checkin are whitelisted. Normal implant communications are not whitelisted at the network level due to subsequently retrieving the second stage implant from a whitelisted source address. This is important, as persistence mechanisms will result in new implants, rather than resuming the previous session. This can make it critical to ensure that you understand which public IP address the target will be connecting from, as without it being whitelisted the (new) persistence based implant is unable to initially connect due to the HTTP 404 error.
During longer term engagements, or with clients who do not fully understand their external footprint, users will open emails on devices that do not connect from the correct IP address, or with the wrong browser. To continue the pretext and prevent suspicion, these can be redirected to a ‘Link Expired’ page. Doug McLeod also wrote an excellent article on how PoshC2 communications work with respect to implant keying. Of key importance is that the PoshC2 dropper will retry to stage after receiving a HTTP 404 (in this scenario, due to the source IP address contained in the X-Forwarded-For header not being whitelisted, and being 404d by Apache). Doug also mentions that the Apache sec.log and CookieDecrypter.py can provide additional safety checks should an implant receive a HTTP 404. Using his script you are able to verify that the implant is coming from a valid corporate domain and valid user context.
With increased visibility comes better decision making.
Nettitude Labs
https://labs.nettitude.com/blog/operational-security-with-poshc2-framework/
For clarity, the 404 redirect is done using this snippet in your rewrite rules:
RewriteMap ips txt:/etc/apache2/whitelist.txt
RewriteCond ${ips:%{REMOTE_ADDR}|NOT-FOUND} !NOT-FOUND [OR]
RewriteCond ${ips:%{HTTP:X-Forwarded-For}|NOT-FOUND} !NOT-FOUND
Alternatives
Monitoring of your access.log can be done through multiple cats, zcats, greps and egreps for certain IP addresses, response codes, URLs and prefixes, however over time that becomes unworkable and imprecise. A better option is to make use of various logging platforms that support Apache logging. This allows you to record, log and graph a number of communications related metrics throughout the engagement. This can include number of phishes, number of failed implant staging, URLs being accessed from non-whitelisted IPs, tracking of customer IP ranges and anti-IR notifications.
During an engagement, I made use of GoAccess to determine the number of 404s for certain payload pages that were not coming from a customer ‘always-on-VPN’ range however felt that it wasn’t customisable enough in a quick fashion, although it was exceptionally lightweight. I also investigated Graylog and Grafana (using such dashboards like this) and Loki. Apache themselves look like they have some form of fledgling product in the form of SuperSet too, however it wasn’t ready for production use.
One option came in the form of an ELK stack, based on my experience with it from my sysadmin and SecurityOnion days. The advantage of ELK is that there is an extremely vibrant user community, as well as being extensively used in the security community. Critically, it also has fairly low resource requirements given the amount of data being collected and the retention requirements, as well as supporting Docker containers. This was important due to several engagements running concurrently, and seeking to minimise and automate infrastructure deployment needs. It would not be realistic in most infrastructures to have individual VMs, each running a full ELK stack.
Getting ELK Running
A very good guide on getting ELK up and running on Docker (on Ubuntu, but will work anywhere) can be found here. Worth noting that initially the Kibana dashboard is only available on http://localhost of the Docker host, but that is fixed through an SSH portforward.
ssh -L 5601:localhost:5601 apachemonitor@192.168.0.11
You can now connect using a browser to https://localhost:5601.
If you are looking to have multiple instances of the ELK stack on one host to allow for segregation of engagements between different teams of operators, you can change the port and volume mappings in the docker-compose.yml file. There is probably some good work to be done in automating the amendment of the docker-compose.yml file, starting ELK and emailing the operator the correct ports and credentials to authenticate.
Also amend /opt/docker-elk/kibana/config/kibana.yml with the credentials used to log into the Kibana dashboard. Slightly confusingly, these are called:
## X-Pack security credentials
#
elasticsearch.username: elastic
elasticsearch.password: changeme
Also amend the /opt/docker-elk/logstash/pipeline/logstash.conf file with stronger credentials.
output {
        elasticsearch {
                hosts => "elasticsearch:9200"
                user => "elastic"
                password => "changeme"
        }
}
Credential rotation can also be done using docker-exec (insert the outputted passwords into the corresponding config files):
docker-compose exec -T elasticsearch bin/elasticsearch-setup-passwords auto --batchOnce you have edited the compose file by following the guide linked above to rotate credentials and change volumes if required, run the ELK stack by running (as root).
docker-compose up
The stack will take a few seconds to fully deploy and boot up. Once up and running you can log into Kibana using the credentials defined previously (the default is elastic:changeme if you didn’t rotate the creds).
Once logged into Kibana, the next step is to start shipping logs from the C2 proxy for analysis. This can be done in various forms ranging from netcat (ship them directly using something similar to: cat apache_logs.txt | nc -q0 127.0.0.1 5000 -nvv) through to the best option, FileBeat. Filebeat is well supported, documented and is available through repositories / wget, making it possible to be installed easily during your C2 Proxy build script / Ansible playbook.
If you just want to experiment, grab some sample data from ElasticSearch themselves here. Worth noting that if you do this, you’ll need to remove any occurrences of the X-Forwarder-For filter in Searches and Visualisations I have provided as the sample access.log won’t have this HTTP header present.
There are lots of guides online on installing Filebeat, and you can also configure Filebeat if any of your logging directories have changed from the defaults, or you have anything else different on your C2 proxies (such as the logging levels, or additional Apache modules (eg mod_python)
It’s worth mentioning that Filebeat communications with the ELK server can be performed fully over TLS – this can made entirely simpler if you are making use of legitimate public certificates and terminating SSL at the C2 server (eg via LetsEncrypt), however if you have your own certificate chain, you can add them to the operating system stores of both the C2 proxy and the ELK server. There are more details on mutual authentication via SSL here and communication here. The key takeaway is that your C2 proxy is likely to be a VPS – don’t ship your logs back to your C2 and monitoring infrastructure insecurely during transit.
It’s worth highlighting here than Filebeat can ship logs directly to ElasticSearch, without any pre-parsing through Logstash – it just depends at what address you point it at during the setup phase. This probably won’t make a huge amount of difference given how small Apache logs are, but if you roll one ELK stack for all engagements, you might want to make sure you take advantage of Logstash’s processing.
Once ELK is up and running, and a C2 proxy is forwarding logs in real-time, now is the time to build our awareness, check for any inbound IR, as well as ensure that the amount of traffic we are generating is not excessive. Note: By default, Filebeat will insert it’s logs into an index called filebeat-*. One aspect of splitting engagements into compartments and preventing cross engagement pollution if you do use a single Kibana instance, is to ensure that each engagement has a dedicated Filebeat index.
Gaining better awareness with ELK
ELK has the Discover pane on the left of the UI, allowing you to begin to build queries, either through Kibana Query Language (KQL), or using the GUI to add fields to the query. Each of these custom searches can then be saved or displayed as Visualisations, and displayed to a Dashboard. Dashboards can be styled using conventional CSS, and arranged in a drag-and-drop fashion. You can find out more about the building blocks of Kibana through the official documentation.
A PluralSight course I found quite useful (especially in figuring out the terms Kibana uses for building visualisations and graphs) can be found here.
One significant usability tweak that proved useful in creating Dashboards was to prefix each item I created and saved in Kibana with it’s type – for example:
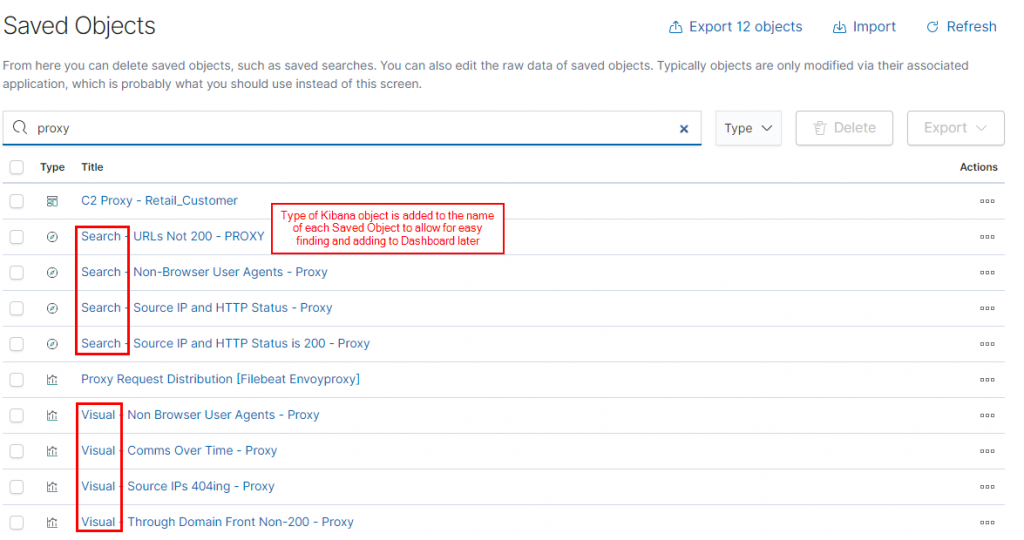
This made it significantly easier to track the various objects as raw logs were turned into searches, visualisations and then added to the correct Dashboard.
In this corresponding GitHub repo are some queries that proved useful in understanding exactly which URLs were being used the most, which WAN IPs were in use, and which dedicated specific phishing/delivery URLs were failing (and why). Rather than exporting them as KQL queries, I’ve exported them as JSON so they are slightly more readable, and can be pasted directly into your own Discover / Visualise panes to get you up and running. Each query is structured to only show traffic that contains an X-Forwarded-For entry – eg has come down a valid domain front. This was done to reduce the amount of internet ‘white noise’ causing HTTP 404s and causing your statistics to be inaccurate.
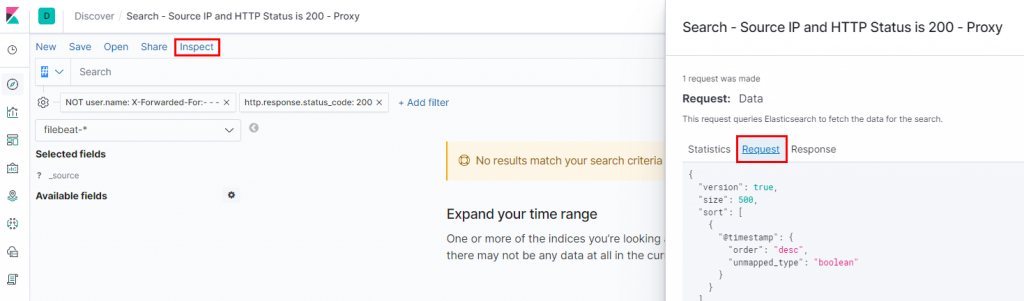
Note: To see the raw JSON for a particular search you have generated (feel free to PR the GitHub repo if you come up with useful searches etc) using the GUI, click Inspect -> Request.
You can import the GitHub objects into your own Kibana via Management -> Saved Objects -> Import.
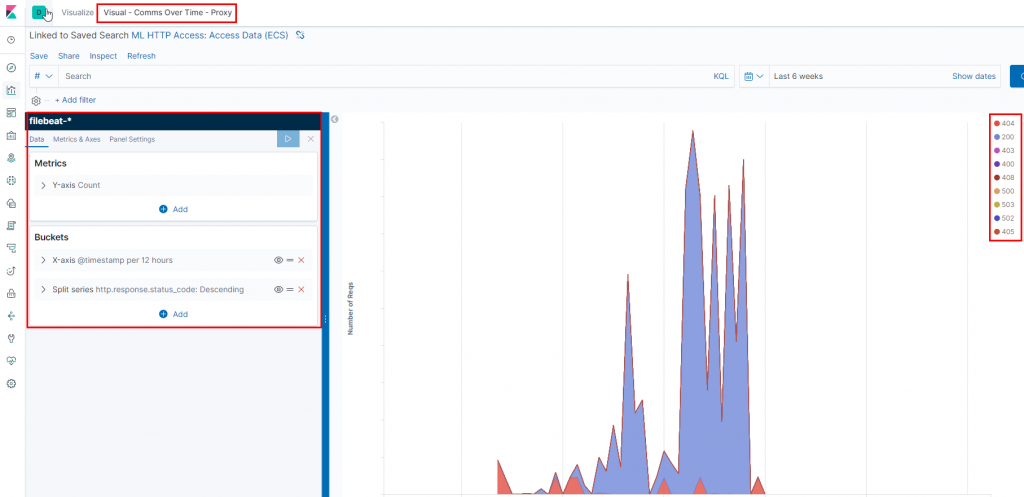
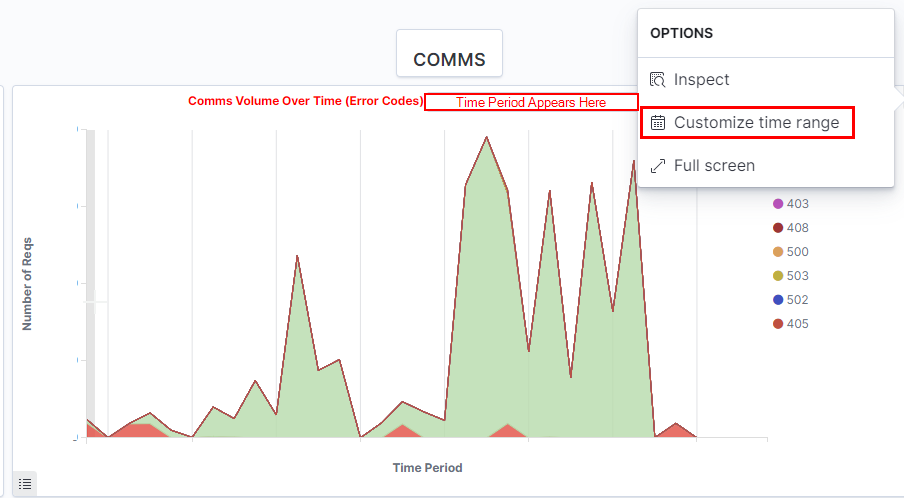
One graph that can be useful in reports and debriefs is the amount of traffic sent via your implants over time, as well as any non-HTTP 200 error codes. These error codes can be linked to the reporting narrative (for example, 404s generated through customer addresses not being on the whitelist) and any constraints encountered during the engagement. It also becomes very obvious when you began making use of SOCKS!
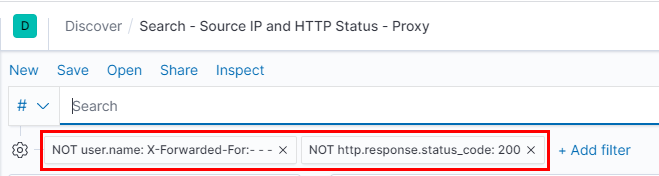
Another query for checking to see whether inaccurate whitelisting is preventing your delivery or implant staging can be seen below (raw query in GitHub). Note how the X-Forwarded-For header is interpreted by Filebeat (and subsequently ES and Kibana) as the user.name field. You can change this in the indexing options within the ELK stack if desired.
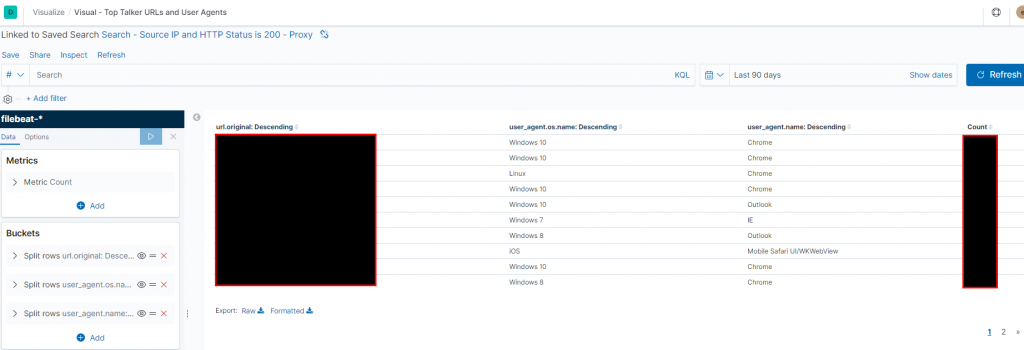
You can also create a table (or a chart, or a pie chart, or a word cloud (!!!) of the top URLs in use by the implants, with the number of requests as well as aspects of the user agents.
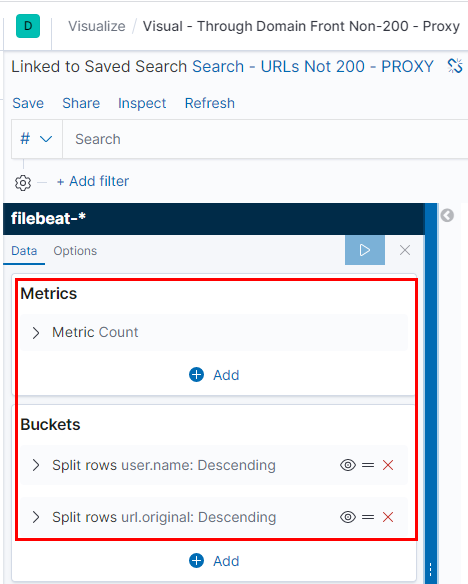
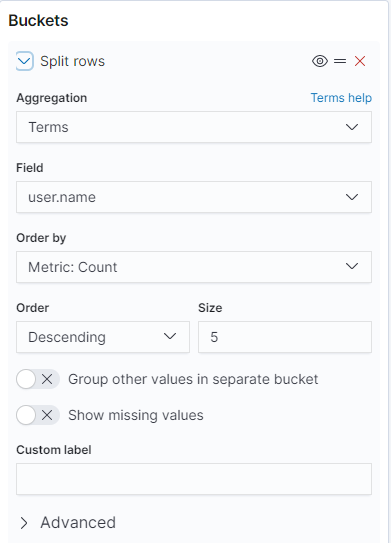
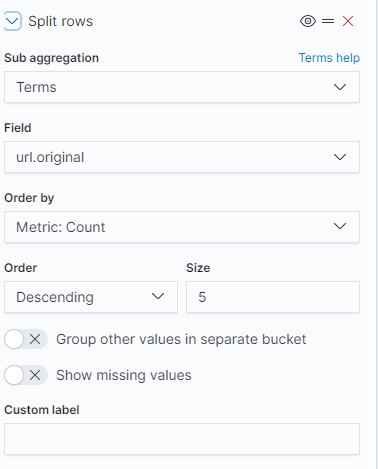
If you are phishing with a weaponised payload being delivered down a domain front, and subsequent payload stages or stagers, a useful table is to show the WAN IP (eg the X-Forwarded-For header), as well as the corresponding URL that is erroring. This table can be created using a setup similar to the below series of steps.
Having split out our data into something useful to visualise, we can now begin to tie it all together into Dashboards. This can be considered the famous ‘pane of glass’ which displays all your queries, searches and visualisations at once to give you an overview at all times. You can also change the length of time that each subpane covers, or change it so that the entire Dashboard covers a particular period. This is especially useful during the phishing phase, when seeing activity in the past 3 minutes is essential. During the post-exploitation phase, a longer view of 3-7 days may be suitable for monitoring stable implants.
A sample Dashboard (JSON in GitHub) can be found below.
Let’s Get Proactive
If we detect any early stages of IR, such as unusual user agents, VirusTotal lookups, or sandboxing agents, it is also possible to create webhooks. The below screenshot will need you to set up an Inbound Webhook in Mattermost, ELK will post into the channel using whichever user was specified in the inbound webhook creation, but can be overridden with various other options.
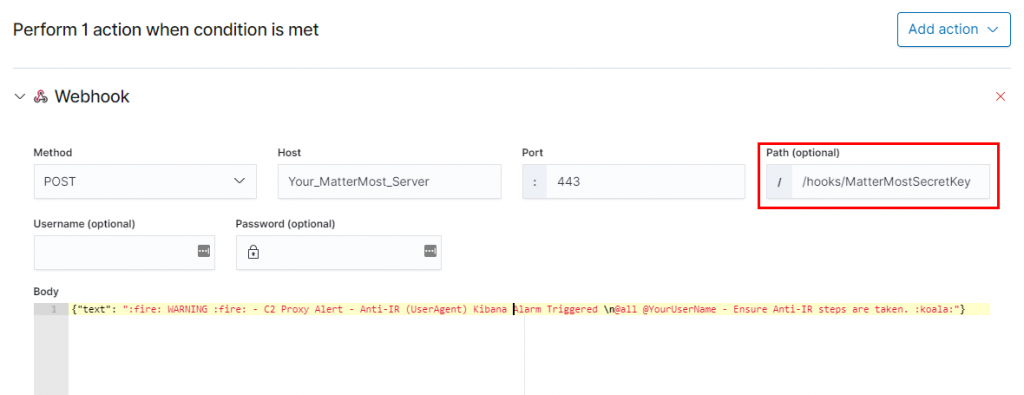
The above request (extracted from screenshot as it is difficult to read) can be seen below:
{"channel": "Project-Retail-Customer", "text": ":fire: WARNING :fire: - C2 Proxy Alert - Anti-IR (UserAgent Based) Kibana Alarm Triggered \n@all @YourUserName - Ensure Anti-IR steps are taken. :koala:"}
Note that the current Docker version of ELK does not interface correctly (link to GitHub issue) with the Pushover API – please get in touch if you know of a fix or better troubleshooting steps. In the interim, monitoring and Pushover notification of Apache logs for certain criteria can be done via Python on the C2 proxy or other mod_python (unsupported by Apache).
Need to Know Principle
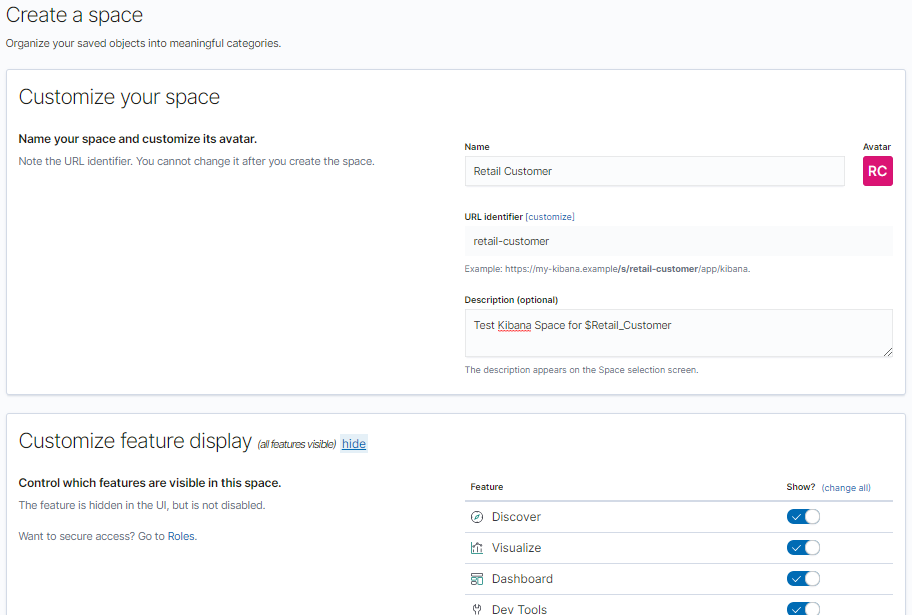
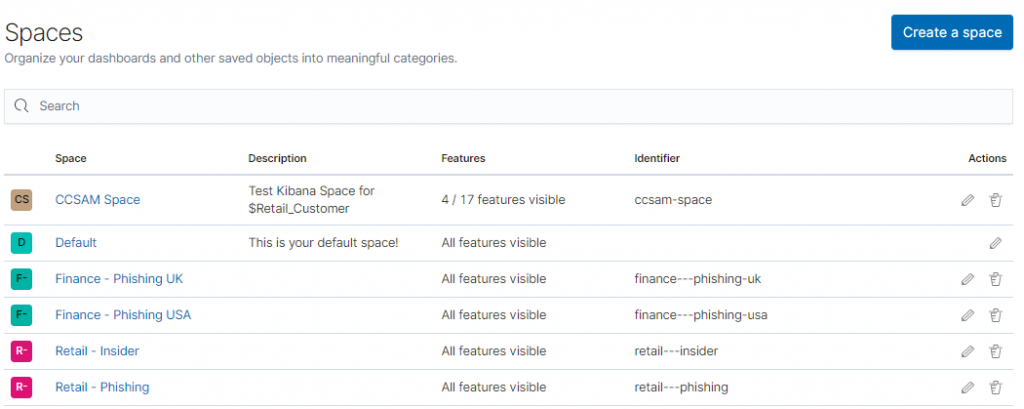
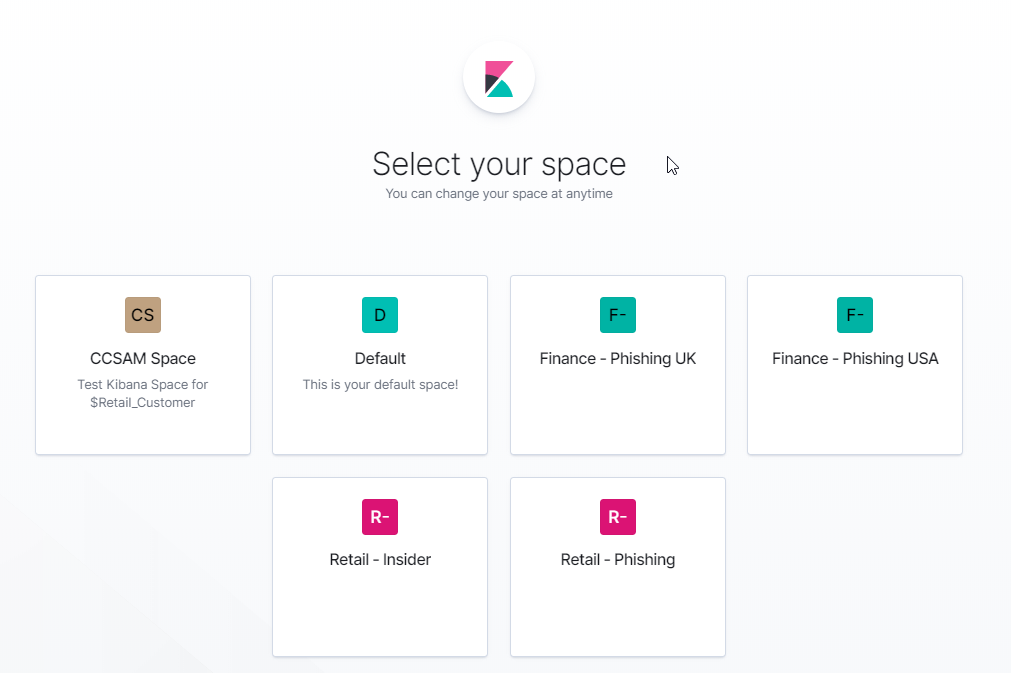
In line with restricting information about particular engagements to only those operators and attack managers who are working within the engagement, it is important to ensure that information related to the C2 traffic is compartmentalised. This can be done at a number of levels depending on the particular project. The ELK stack can be deployed on it’s own virtual server, as a separate Docker instance, using a separate Filebeat index, or within Kibana itself using the concept of Spaces. Additionally, you could also grant / restrict access to individual Dashboards to particular Kibana usernames for each operator (which can be created in Management).
One way of achieving this is to have the CCSAM or overall Tech Lead overseeing various engagements have access to each engagement Space that they are responsible for, each with a standard or customised dashboard. Spaces also work well as you can create and update Kibana Spaces using the API (documentation here), making it an attractive way to automate the rollout of dedicated spaces using your existing automation.
You can also restrict functionality available within the Space, just in case you have less technical people monitoring the engagement and you want to minimise the chance of settings getting changed inadvertently.
By creating multiple Spaces, you can have a single Kibana instance that can quickly take you to a particular engagement, within which is all of the data in a dedicated index, with dedicated Dashboards.
This could be especially useful in longer-term, research led red team engagements, where the customer has agreed that particular scenarios will last for months or years, but without active operations occurring each day. By having dedicated Spaces, operators can quickly get back up to speed with their comms infrastructure after a period of time away from the engagement.
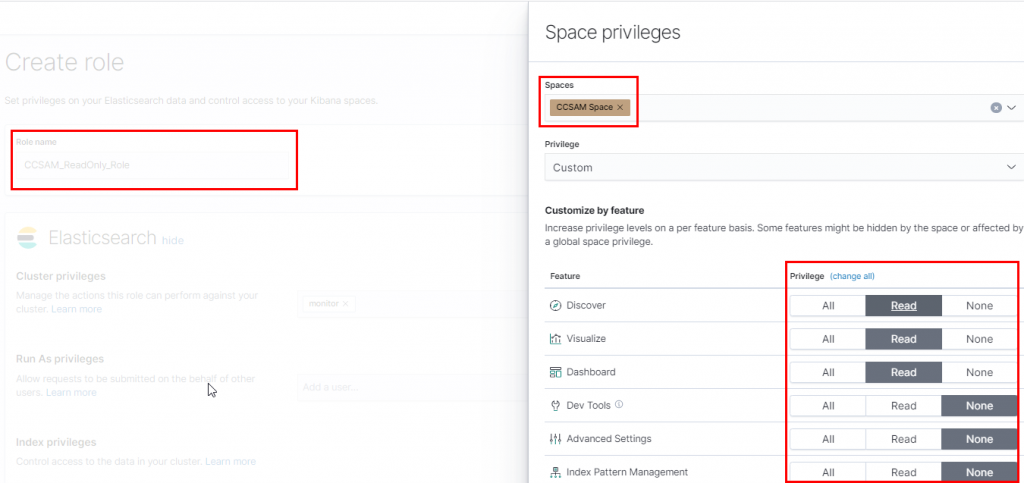
Kibana also offers the concept of Users and Roles. Roles are collections of rules that can be assigned to users (similar to AD groups), this would provide a way of quickly granting suitable permissions to new operators or CCSAMs. Roles can be allowed access to particular Spaces in the following manner. Management -> Roles -> Create Role -> Scroll Down -> Space Privileges.
One option could be to have a CCSAM role with Read Only rights to various aspects of Kibana (you can also restrict ElasticSearch permissions), with a RedTeam_Operator role having more freedom within Kibana to create new queries and visualisations.
Creating Users and Dashboards via API (automation)
For a Dashboard system to be workable at scale in a fast paced consultancy business, some form of automation is absolutely necessary. Inputting each saved search, visualisation and dashboard into Spaces is unworkable outside of long term engagements for most firms. Luckily Kibana (and ES) has an API that will allow you to provision most aspects of the deployment.
If you have a single Kibana server / cluster for all engagements, then creating users and assigning roles is already done (can also be done via API), which leaves you to import the GitHub JSONs via API. You can also create Spaces and adjust permissions using the Users and Roles APIs. Successful requests receive a HTTP 204 rather than HTTP 200, so don’t panic. For example, to grant dashboard-only (eg CCSAM) access to the Retail Customer Space:
Host: https://yourkibanaserver
PUT /api/security/role/CCSAM_Role
{
  "metadata" : {
    "version" : 1
  },
  "elasticsearch": {
    "cluster" : [ ],
    "indices" : [ ]
  },
  "kibana": [
    {
      "base": [],
      "feature": {
        "dashboard": ["read"]
      },
      "spaces": [
        "Retail-Customer"
      ]
    }
  ]
}
To import your Dashboards onto your newly deployed Kibana server / Docker container / engagement-specific Space, you can also make use of the Dashboard API. Syntax is pretty important, so the ELK docs themselves say to use the Body from the Export API call (from whichever Kibana server you want to clone from) as your input for the Input API call. You can find your Dashboard GUID from the URL bar whilst viewing the Dashboard.
To export from Master Kibana Server:
GET api/kibana/dashboards/export?dashboard=<DASHBOARD_GUID>
You’ll receive a fair old wall of text. Use this as the input for the import API call.
Conclusion
Hopefully this post has showed how useful making use of monitoring can be to ensuring that complicated and long-running engagements can be improved through analysis of C2 traffic. Being able to demonstrate and provide granular data (eg which user, which OS) on the number of HTTP 404s on weaponised links generated will be of value to our customers (in this scenario, this could indicate the presence of a legacy proxy, or the always-on VPN not working correctly). When combined with other monitoring and domain keying / PoshC2 sec.log analysis, this can ensure that our operations remain secure and safe.
This sort of data can also provide alerting should an operator leave the implant beaconing too frequently, without using enough disparate URLs, or provide metrics for debriefing – for example, extracting 500MB of test data out of an environment without triggering DLP solutions. Using metrics, you are able to determine quickly how many HTTP requests this was, as well as the exact URLs used by the implant.
This post is meant more of a stimulus to think ‘we should look into this for our red team’ rather than ‘we should implement this exactly like this’.
There may well be better tools that suit this role already (Twitter me up!), I used ELK due to it being used as a SIEM in many environments, and having solid documentation. It is also possible to extend this logging to collect syslog data from your C2 proxies, fail2ban information and other good systems administration metrics. C2 proxies are a critical (and often single point of failure) part of your attack infrastructure, so it is professional and comprehensive to monitor and secure them as you would any other part of the corporate or attack infrastructure.
If you have any ideas for useful searches, visualisations and dashboards, let me know via Twitter or PR on GitHub.